
2. EDA#
![]()
在上一章中,我们了解了可用于时间序列分析的深度学习模型结构和模型评价指标。在我们开始认真分析时间序列数据之前,我们将探索并可视化将在第 2 章中用于分析的数据集。
用于时间序列预测的数据是冠状病毒确诊病例数据。该数据集来自 COVID-19 Data Repository by the Center for Systems Science and Engineering (CSSE) at Johns Hopkins University和 Kaggle: Novel Corona Virus 2019 Dataset .
约翰·霍普金斯大学的信息库每天都会更新各国确诊病例的状态,并以每日报告的形式提供。存储库中还提供了通过修改日报格式处理的整个期间的报告。此外,Kaggle 提供的数据结合了所有数据,同时保留了每日报告格式。
在 2.1 节中,我们将下载数据并找出它包含哪些变量。在第 2.2 节中,我们将研究随着冠状病毒在全球传播,世界各地确诊病例的趋势,在第 2.3 节中,我们将更详细地探讨韩国的确诊病例。
2.1 数据下载#
首先,让我们下载新冠确诊患者数据集。您可以使用Fake Research Institute提供的数据加载功能轻松接收它。
git clone使用命令将Tutorial-Book-Utils存储库下载到Colab环境。 \
!git clone https://github.com/Pseudo-Lab/Tutorial-Book-Utils
'git' 不是内部或外部命令,也不是可运行的程序
或批处理文件。

图2-1 Tutorial-Book-Utils存储库文件夹路径
如图2-1所示,您可以下载存储中的所有文件,并PL_data_loader.py查看文件位于其中的位置。该文件包含下载 Google Drive 数据集的函数。如果您输入–data参数COVIDTimeSeries,您可以接收有关冠状病毒确诊病例数量的数据,以用于构建模型。
!python Tutorial-Book-Utils/PL_data_loader.py --data COVIDTimeSeries
python: can't open file 'D:\3000-code\deeplearning\DeepLearning2023\Deeplearning\chapters\chpt4\Tutorial-Book-Utils\PL_data_loader.py': [Errno 2] No such file or directory
接下来,unzip我们使用 Linux 命令解压压缩文件。-q选项可用于控制不必要的输出。
!unzip -q COVIDTimeSeries.zip
'unzip' 不是内部或外部命令,也不是可运行的程序
或批处理文件。

图2-2 下载的数据集文件
解压后可以看到文件已经下载完毕,如图2-2所示covid_19_data.csv。time_series_covid19_confirmed_global.csv
covid_19_data.csv我们将使用该文件来可视化随着时间的推移世界各地确诊病例的状态,我们time_series_covid19_confirmed_global.csv将使用文件中的韩国数据来可视化确诊病例数量的变化。首先,让我们读取每个数据并检查存储的值。
import pandas as pd

all = pd.read_csv('covid_19_data.csv')
confirmed = pd.read_csv('time_series_covid19_confirmed_global.csv')
---------------------------------------------------------------------------
FileNotFoundError                         Traceback (most recent call last)
Cell In[4], line 3
      1 import pandas as pd
----> 3 all = pd.read_csv('covid_19_data.csv')
      4 confirmed = pd.read_csv('time_series_covid19_confirmed_global.csv')

File D:\Program Files\Python39\lib\site-packages\pandas\io\parsers\readers.py:1026, in read_csv(filepath_or_buffer, sep, delimiter, header, names, index_col, usecols, dtype, engine, converters, true_values, false_values, skipinitialspace, skiprows, skipfooter, nrows, na_values, keep_default_na, na_filter, verbose, skip_blank_lines, parse_dates, infer_datetime_format, keep_date_col, date_parser, date_format, dayfirst, cache_dates, iterator, chunksize, compression, thousands, decimal, lineterminator, quotechar, quoting, doublequote, escapechar, comment, encoding, encoding_errors, dialect, on_bad_lines, delim_whitespace, low_memory, memory_map, float_precision, storage_options, dtype_backend)
   1013 kwds_defaults = _refine_defaults_read(
   1014     dialect,
   1015     delimiter,
   (...)
   1022     dtype_backend=dtype_backend,
   1023 )
   1024 kwds.update(kwds_defaults)
-> 1026 return _read(filepath_or_buffer, kwds)

File D:\Program Files\Python39\lib\site-packages\pandas\io\parsers\readers.py:620, in _read(filepath_or_buffer, kwds)
    617 _validate_names(kwds.get("names", None))
    619 # Create the parser.
--> 620 parser = TextFileReader(filepath_or_buffer, **kwds)
    622 if chunksize or iterator:
    623     return parser

File D:\Program Files\Python39\lib\site-packages\pandas\io\parsers\readers.py:1620, in TextFileReader.__init__(self, f, engine, **kwds)
   1617     self.options["has_index_names"] = kwds["has_index_names"]
   1619 self.handles: IOHandles | None = None
-> 1620 self._engine = self._make_engine(f, self.engine)

File D:\Program Files\Python39\lib\site-packages\pandas\io\parsers\readers.py:1880, in TextFileReader._make_engine(self, f, engine)
   1878     if "b" not in mode:
   1879         mode += "b"
-> 1880 self.handles = get_handle(
   1881     f,
   1882     mode,
   1883     encoding=self.options.get("encoding", None),
   1884     compression=self.options.get("compression", None),
   1885     memory_map=self.options.get("memory_map", False),
   1886     is_text=is_text,
   1887     errors=self.options.get("encoding_errors", "strict"),
   1888     storage_options=self.options.get("storage_options", None),
   1889 )
   1890 assert self.handles is not None
   1891 f = self.handles.handle

File D:\Program Files\Python39\lib\site-packages\pandas\io\common.py:873, in get_handle(path_or_buf, mode, encoding, compression, memory_map, is_text, errors, storage_options)
    868 elif isinstance(handle, str):
    869     # Check whether the filename is to be opened in binary mode.
    870     # Binary mode does not support 'encoding' and 'newline'.
    871     if ioargs.encoding and "b" not in ioargs.mode:
    872         # Encoding
--> 873         handle = open(
    874             handle,
    875             ioargs.mode,
    876             encoding=ioargs.encoding,
    877             errors=errors,
    878             newline="",
    879         )
    880     else:
    881         # Binary mode
    882         handle = open(handle, ioargs.mode)

FileNotFoundError: [Errno 2] No such file or directory: 'covid_19_data.csv'
all是世界各地每日确诊病例、死亡和康复的数据。代表ObservationDate发生日期,Province/State代表Country/Region发生地区和国家,Confirmed代表确诊人数,Deaths代表死亡人数,Recovered代表治愈人数。对应的dataframe如下:
all
| SNo | ObservationDate | Province/State | Country/Region | Last Update | Confirmed | Deaths | Recovered | |
|---|---|---|---|---|---|---|---|---|
| 0 | 1 | 01/22/2020 | Anhui | Mainland China | 1/22/2020 17:00 | 1.0 | 0.0 | 0.0 |
| 1 | 2 | 01/22/2020 | Beijing | Mainland China | 1/22/2020 17:00 | 14.0 | 0.0 | 0.0 |
| 2 | 3 | 01/22/2020 | Chongqing | Mainland China | 1/22/2020 17:00 | 6.0 | 0.0 | 0.0 |
| 3 | 4 | 01/22/2020 | Fujian | Mainland China | 1/22/2020 17:00 | 1.0 | 0.0 | 0.0 |
| 4 | 5 | 01/22/2020 | Gansu | Mainland China | 1/22/2020 17:00 | 0.0 | 0.0 | 0.0 |
| ... | ... | ... | ... | ... | ... | ... | ... | ... |
| 172475 | 172476 | 12/06/2020 | Zaporizhia Oblast | Ukraine | 2020-12-07 05:26:14 | 36539.0 | 337.0 | 6556.0 |
| 172476 | 172477 | 12/06/2020 | Zeeland | Netherlands | 2020-12-07 05:26:14 | 6710.0 | 104.0 | 0.0 |
| 172477 | 172478 | 12/06/2020 | Zhejiang | Mainland China | 2020-12-07 05:26:14 | 1295.0 | 1.0 | 1288.0 |
| 172478 | 172479 | 12/06/2020 | Zhytomyr Oblast | Ukraine | 2020-12-07 05:26:14 | 31967.0 | 531.0 | 22263.0 |
| 172479 | 172480 | 12/06/2020 | Zuid-Holland | Netherlands | 2020-12-07 05:26:14 | 154813.0 | 2414.0 | 0.0 |
172480 rows × 8 columns
confirmed是按国家/地区划分的确诊病例数的序列数据。Country/Region,Province/State指发生地区和国家,Long, 指Lat经度和纬度,MM/DD/YYYY指按日期划分的确诊病例数。对应的dataframe如下:
confirmed
| Province/State | Country/Region | Lat | Long | 1/22/20 | 1/23/20 | 1/24/20 | 1/25/20 | 1/26/20 | 1/27/20 | 1/28/20 | 1/29/20 | 1/30/20 | 1/31/20 | 2/1/20 | 2/2/20 | 2/3/20 | 2/4/20 | 2/5/20 | 2/6/20 | 2/7/20 | 2/8/20 | 2/9/20 | 2/10/20 | 2/11/20 | 2/12/20 | 2/13/20 | 2/14/20 | 2/15/20 | 2/16/20 | 2/17/20 | 2/18/20 | 2/19/20 | 2/20/20 | 2/21/20 | 2/22/20 | 2/23/20 | 2/24/20 | 2/25/20 | 2/26/20 | ... | 11/9/20 | 11/10/20 | 11/11/20 | 11/12/20 | 11/13/20 | 11/14/20 | 11/15/20 | 11/16/20 | 11/17/20 | 11/18/20 | 11/19/20 | 11/20/20 | 11/21/20 | 11/22/20 | 11/23/20 | 11/24/20 | 11/25/20 | 11/26/20 | 11/27/20 | 11/28/20 | 11/29/20 | 11/30/20 | 12/1/20 | 12/2/20 | 12/3/20 | 12/4/20 | 12/5/20 | 12/6/20 | 12/7/20 | 12/8/20 | 12/9/20 | 12/10/20 | 12/11/20 | 12/12/20 | 12/13/20 | 12/14/20 | 12/15/20 | 12/16/20 | 12/17/20 | 12/18/20 | |
|---|---|---|---|---|---|---|---|---|---|---|---|---|---|---|---|---|---|---|---|---|---|---|---|---|---|---|---|---|---|---|---|---|---|---|---|---|---|---|---|---|---|---|---|---|---|---|---|---|---|---|---|---|---|---|---|---|---|---|---|---|---|---|---|---|---|---|---|---|---|---|---|---|---|---|---|---|---|---|---|---|---|
| 0 | NaN | Afghanistan | 33.939110 | 67.709953 | 0 | 0 | 0 | 0 | 0 | 0 | 0 | 0 | 0 | 0 | 0 | 0 | 0 | 0 | 0 | 0 | 0 | 0 | 0 | 0 | 0 | 0 | 0 | 0 | 0 | 0 | 0 | 0 | 0 | 0 | 0 | 0 | 0 | 1 | 1 | 1 | ... | 42297 | 42463 | 42609 | 42795 | 42969 | 43035 | 43240 | 43468 | 43681 | 43924 | 44177 | 44363 | 44503 | 44706 | 44988 | 45174 | 45384 | 45600 | 45723 | 45844 | 46116 | 46274 | 46516 | 46718 | 46837 | 46837 | 47072 | 47306 | 47516 | 47716 | 47851 | 48053 | 48116 | 48229 | 48527 | 48718 | 48952 | 49161 | 49378 | 49621 |
| 1 | NaN | Albania | 41.153300 | 20.168300 | 0 | 0 | 0 | 0 | 0 | 0 | 0 | 0 | 0 | 0 | 0 | 0 | 0 | 0 | 0 | 0 | 0 | 0 | 0 | 0 | 0 | 0 | 0 | 0 | 0 | 0 | 0 | 0 | 0 | 0 | 0 | 0 | 0 | 0 | 0 | 0 | ... | 24731 | 25294 | 25801 | 26211 | 26701 | 27233 | 27830 | 28432 | 29126 | 29837 | 30623 | 31459 | 32196 | 32761 | 33556 | 34300 | 34944 | 35600 | 36245 | 36790 | 37625 | 38182 | 39014 | 39719 | 40501 | 41302 | 42148 | 42988 | 43683 | 44436 | 45188 | 46061 | 46863 | 47742 | 48530 | 49191 | 50000 | 50637 | 51424 | 52004 |
| 2 | NaN | Algeria | 28.033900 | 1.659600 | 0 | 0 | 0 | 0 | 0 | 0 | 0 | 0 | 0 | 0 | 0 | 0 | 0 | 0 | 0 | 0 | 0 | 0 | 0 | 0 | 0 | 0 | 0 | 0 | 0 | 0 | 0 | 0 | 0 | 0 | 0 | 0 | 0 | 0 | 1 | 1 | ... | 62693 | 63446 | 64257 | 65108 | 65975 | 66819 | 67679 | 68589 | 69591 | 70629 | 71652 | 72755 | 73774 | 74862 | 75867 | 77000 | 78025 | 79110 | 80168 | 81212 | 82221 | 83199 | 84152 | 85084 | 85927 | 86730 | 87502 | 88252 | 88825 | 89416 | 90014 | 90579 | 91121 | 91638 | 92102 | 92597 | 93065 | 93507 | 93933 | 94371 |
| 3 | NaN | Andorra | 42.506300 | 1.521800 | 0 | 0 | 0 | 0 | 0 | 0 | 0 | 0 | 0 | 0 | 0 | 0 | 0 | 0 | 0 | 0 | 0 | 0 | 0 | 0 | 0 | 0 | 0 | 0 | 0 | 0 | 0 | 0 | 0 | 0 | 0 | 0 | 0 | 0 | 0 | 0 | ... | 5437 | 5477 | 5567 | 5616 | 5725 | 5725 | 5872 | 5914 | 5951 | 6018 | 6066 | 6142 | 6207 | 6256 | 6304 | 6351 | 6428 | 6534 | 6610 | 6610 | 6712 | 6745 | 6790 | 6842 | 6904 | 6955 | 7005 | 7050 | 7084 | 7127 | 7162 | 7190 | 7236 | 7288 | 7338 | 7382 | 7382 | 7446 | 7466 | 7519 |
| 4 | NaN | Angola | -11.202700 | 17.873900 | 0 | 0 | 0 | 0 | 0 | 0 | 0 | 0 | 0 | 0 | 0 | 0 | 0 | 0 | 0 | 0 | 0 | 0 | 0 | 0 | 0 | 0 | 0 | 0 | 0 | 0 | 0 | 0 | 0 | 0 | 0 | 0 | 0 | 0 | 0 | 0 | ... | 12680 | 12816 | 12953 | 13053 | 13228 | 13374 | 13451 | 13615 | 13818 | 13922 | 14134 | 14267 | 14413 | 14493 | 14634 | 14742 | 14821 | 14920 | 15008 | 15087 | 15103 | 15139 | 15251 | 15319 | 15361 | 15493 | 15536 | 15591 | 15648 | 15729 | 15804 | 15925 | 16061 | 16161 | 16188 | 16277 | 16362 | 16407 | 16484 | 16562 |
| ... | ... | ... | ... | ... | ... | ... | ... | ... | ... | ... | ... | ... | ... | ... | ... | ... | ... | ... | ... | ... | ... | ... | ... | ... | ... | ... | ... | ... | ... | ... | ... | ... | ... | ... | ... | ... | ... | ... | ... | ... | ... | ... | ... | ... | ... | ... | ... | ... | ... | ... | ... | ... | ... | ... | ... | ... | ... | ... | ... | ... | ... | ... | ... | ... | ... | ... | ... | ... | ... | ... | ... | ... | ... | ... | ... | ... | ... | ... | ... | ... | ... |
| 266 | NaN | Vietnam | 14.058324 | 108.277199 | 0 | 2 | 2 | 2 | 2 | 2 | 2 | 2 | 2 | 2 | 6 | 6 | 8 | 8 | 8 | 10 | 10 | 13 | 13 | 14 | 15 | 15 | 16 | 16 | 16 | 16 | 16 | 16 | 16 | 16 | 16 | 16 | 16 | 16 | 16 | 16 | ... | 1215 | 1226 | 1252 | 1253 | 1256 | 1265 | 1281 | 1283 | 1288 | 1300 | 1304 | 1305 | 1306 | 1307 | 1312 | 1316 | 1321 | 1331 | 1339 | 1341 | 1343 | 1347 | 1351 | 1358 | 1361 | 1361 | 1365 | 1366 | 1367 | 1377 | 1381 | 1385 | 1391 | 1395 | 1397 | 1402 | 1405 | 1405 | 1407 | 1410 |
| 267 | NaN | West Bank and Gaza | 31.952200 | 35.233200 | 0 | 0 | 0 | 0 | 0 | 0 | 0 | 0 | 0 | 0 | 0 | 0 | 0 | 0 | 0 | 0 | 0 | 0 | 0 | 0 | 0 | 0 | 0 | 0 | 0 | 0 | 0 | 0 | 0 | 0 | 0 | 0 | 0 | 0 | 0 | 0 | ... | 58838 | 59422 | 60065 | 60784 | 61514 | 62167 | 63031 | 63867 | 64935 | 66186 | 67296 | 68768 | 70254 | 71644 | 73196 | 75007 | 76727 | 78493 | 80429 | 81890 | 83585 | 85647 | 88004 | 90192 | 92708 | 94676 | 96098 | 98038 | 99758 | 101109 | 102992 | 104879 | 106622 | 108099 | 109738 | 111102 | 113409 | 115606 | 117755 | 119612 |
| 268 | NaN | Yemen | 15.552727 | 48.516388 | 0 | 0 | 0 | 0 | 0 | 0 | 0 | 0 | 0 | 0 | 0 | 0 | 0 | 0 | 0 | 0 | 0 | 0 | 0 | 0 | 0 | 0 | 0 | 0 | 0 | 0 | 0 | 0 | 0 | 0 | 0 | 0 | 0 | 0 | 0 | 0 | ... | 2071 | 2071 | 2071 | 2071 | 2072 | 2072 | 2072 | 2078 | 2081 | 2083 | 2086 | 2090 | 2093 | 2099 | 2107 | 2114 | 2124 | 2137 | 2148 | 2160 | 2177 | 2191 | 2197 | 2217 | 2239 | 2267 | 2304 | 2337 | 2383 | 2078 | 2079 | 2081 | 2082 | 2083 | 2083 | 2084 | 2085 | 2085 | 2087 | 2087 |
| 269 | NaN | Zambia | -13.133897 | 27.849332 | 0 | 0 | 0 | 0 | 0 | 0 | 0 | 0 | 0 | 0 | 0 | 0 | 0 | 0 | 0 | 0 | 0 | 0 | 0 | 0 | 0 | 0 | 0 | 0 | 0 | 0 | 0 | 0 | 0 | 0 | 0 | 0 | 0 | 0 | 0 | 0 | ... | 16971 | 16997 | 17036 | 17056 | 17093 | 17097 | 17123 | 17187 | 17243 | 17280 | 17350 | 17373 | 17394 | 17424 | 17454 | 17466 | 17535 | 17553 | 17569 | 17589 | 17608 | 17647 | 17665 | 17700 | 17730 | 17857 | 17898 | 17916 | 17931 | 17963 | 18062 | 18091 | 18161 | 18217 | 18274 | 18322 | 18428 | 18456 | 18504 | 18575 |
| 270 | NaN | Zimbabwe | -19.015438 | 29.154857 | 0 | 0 | 0 | 0 | 0 | 0 | 0 | 0 | 0 | 0 | 0 | 0 | 0 | 0 | 0 | 0 | 0 | 0 | 0 | 0 | 0 | 0 | 0 | 0 | 0 | 0 | 0 | 0 | 0 | 0 | 0 | 0 | 0 | 0 | 0 | 0 | ... | 8561 | 8610 | 8667 | 8696 | 8765 | 8786 | 8829 | 8897 | 8945 | 8981 | 9046 | 9120 | 9172 | 9220 | 9308 | 9398 | 9508 | 9623 | 9714 | 9822 | 9822 | 9950 | 10129 | 10129 | 10424 | 10547 | 10617 | 10718 | 10839 | 10912 | 11007 | 11081 | 11162 | 11219 | 11246 | 11358 | 11522 | 11749 | 11866 | 12047 |
271 rows × 336 columns
2.2 全球数据 EDA#
all让我们来可视化世界各地确诊的冠状病毒病例数。在这个数据框中,有两个代表位置的变量:(Province/State地区)和(国家)。Country/Region为了可视化按国家/地区划分的确诊病例数,Country/Region您需要将该国家/地区的所有确诊病例数相加作为标准。让我们使用下面的代码来实现它。
group = all.groupby(['ObservationDate', 'Country/Region'])['Confirmed'].sum()
group = group.reset_index()
group.head()
| ObservationDate | Country/Region | Confirmed | |
|---|---|---|---|
| 0 | 01/22/2020 | Hong Kong | 0.0 |
| 1 | 01/22/2020 | Japan | 2.0 |
| 2 | 01/22/2020 | Macau | 1.0 |
| 3 | 01/22/2020 | Mainland China | 547.0 |
| 4 | 01/22/2020 | South Korea | 1.0 |
您可以看到已按日期得出按国家/地区划分的确诊病例总数。接下来,我们使用动画效果在世界地图上按国家显示确诊病例数。这plotly.express可以使用包来表达。
import plotly as py
import plotly.express as px
首先,px.choropleth使用 创建地图图层.update_layout并使用 更新日期。
各参数含义如下。
location:指示数据框中位置的列
locationmode :要表示的国家/地区范围(“ISO-3”、“美国州”或“国家/地区名称”之一)
颜色:要在数据框中绘制图表的列
animation_frame:dataframe中动画效果的标准列
如果按播放按钮,您可以查看每日确诊病例图表。
choro_map=px.choropleth(group,
                    locations="Country/Region",
                    locationmode = "country names",
                    color="Confirmed",
                    animation_frame="ObservationDate"
                   )

choro_map.update_layout(
    title_text = 'Global Spread of Coronavirus',
    title_x = 0.5,
    geo=dict(
        showframe = False,
        showcoastlines = False,
    ))

choro_map.show()
它首先起源于中国,并逐渐蔓延到世界各地。最近我们可以看到,北美、南美、印度的确诊病例数高于其他地区。
2.3 韩国数据EDA#
这次,confirmed我们只提取韩国的数据。该数据为累计数据,指截至该日期的确诊病例总数。
confirmed[confirmed['Country/Region']=='Korea, South']
| Province/State | Country/Region | Lat | Long | 1/22/20 | 1/23/20 | 1/24/20 | 1/25/20 | 1/26/20 | 1/27/20 | 1/28/20 | 1/29/20 | 1/30/20 | 1/31/20 | 2/1/20 | 2/2/20 | 2/3/20 | 2/4/20 | 2/5/20 | 2/6/20 | 2/7/20 | 2/8/20 | 2/9/20 | 2/10/20 | 2/11/20 | 2/12/20 | 2/13/20 | 2/14/20 | 2/15/20 | 2/16/20 | 2/17/20 | 2/18/20 | 2/19/20 | 2/20/20 | 2/21/20 | 2/22/20 | 2/23/20 | 2/24/20 | 2/25/20 | 2/26/20 | ... | 11/9/20 | 11/10/20 | 11/11/20 | 11/12/20 | 11/13/20 | 11/14/20 | 11/15/20 | 11/16/20 | 11/17/20 | 11/18/20 | 11/19/20 | 11/20/20 | 11/21/20 | 11/22/20 | 11/23/20 | 11/24/20 | 11/25/20 | 11/26/20 | 11/27/20 | 11/28/20 | 11/29/20 | 11/30/20 | 12/1/20 | 12/2/20 | 12/3/20 | 12/4/20 | 12/5/20 | 12/6/20 | 12/7/20 | 12/8/20 | 12/9/20 | 12/10/20 | 12/11/20 | 12/12/20 | 12/13/20 | 12/14/20 | 12/15/20 | 12/16/20 | 12/17/20 | 12/18/20 | |
|---|---|---|---|---|---|---|---|---|---|---|---|---|---|---|---|---|---|---|---|---|---|---|---|---|---|---|---|---|---|---|---|---|---|---|---|---|---|---|---|---|---|---|---|---|---|---|---|---|---|---|---|---|---|---|---|---|---|---|---|---|---|---|---|---|---|---|---|---|---|---|---|---|---|---|---|---|---|---|---|---|---|
| 157 | NaN | Korea, South | 35.907757 | 127.766922 | 1 | 1 | 2 | 2 | 3 | 4 | 4 | 4 | 4 | 11 | 12 | 15 | 15 | 16 | 19 | 23 | 24 | 24 | 25 | 27 | 28 | 28 | 28 | 28 | 28 | 29 | 30 | 31 | 31 | 104 | 204 | 433 | 602 | 833 | 977 | 1261 | ... | 27653 | 27799 | 27942 | 28133 | 28338 | 28546 | 28769 | 28998 | 29311 | 29654 | 30017 | 30403 | 30733 | 31004 | 31353 | 31735 | 32318 | 32887 | 33375 | 33824 | 34201 | 34652 | 35163 | 35703 | 36332 | 36915 | 37546 | 38161 | 38755 | 39432 | 40098 | 40786 | 41736 | 42766 | 43484 | 44364 | 45442 | 46453 | 47515 | 48570 |
1 rows × 336 columns
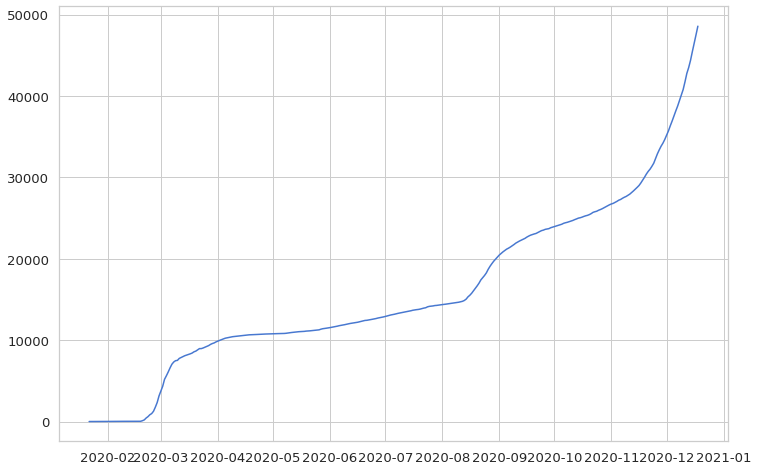
这里,我们只留下确诊病例数信息,不包括地区名称和经纬度。然后,为了方便起见,更改了行和列(.T),并将作为索引的日期从 str 格式更改为 datetime 格式(to_datetime)。
korea = confirmed[confirmed['Country/Region']=='Korea, South'].iloc[:,4:].T
korea.index = pd.to_datetime(korea.index)
korea
| 157 | |
|---|---|
| 2020-01-22 | 1 |
| 2020-01-23 | 1 |
| 2020-01-24 | 2 |
| 2020-01-25 | 2 |
| 2020-01-26 | 3 |
| ... | ... |
| 2020-12-14 | 44364 |
| 2020-12-15 | 45442 |
| 2020-12-16 | 46453 |
| 2020-12-17 | 47515 |
| 2020-12-18 | 48570 |
332 rows × 1 columns
让我们使用最具代表性的可视化包来可视化它:matplotlib.pyplot和。seaborn这时候就可以直接在对应的单元格中显示图形了。您可以调整图表的大小,还可以调整网格的颜色和字体大小。%matplotlib inlinepylabrcParams[‘figure.figsize’]sns.set
import matplotlib.pyplot as plt
import seaborn as sns
%matplotlib inline
from pylab import rcParams
rcParams['figure.figsize'] = 12, 8
sns.set(style='whitegrid', palette='muted', font_scale=1.2)

plt.plot(korea)
plt.show()
这次我们看的是每日确诊病例数,而不是累计数据。diff通过使用 ,您可以找到与上一行的差异,因此您可以轻松地将累计数据更改为每日数据。但是,第一行中存在缺失值,因此必须用累积数据的第一个值来填充这些值。并将数据类型更改为int(整数)。
daily_cases = korea.diff().fillna(korea.iloc[0]).astype('int')
daily_cases
| 157 | |
|---|---|
| 2020-01-22 | 1 |
| 2020-01-23 | 0 |
| 2020-01-24 | 1 |
| 2020-01-25 | 0 |
| 2020-01-26 | 1 |
| ... | ... |
| 2020-12-14 | 880 |
| 2020-12-15 | 1078 |
| 2020-12-16 | 1011 |
| 2020-12-17 | 1062 |
| 2020-12-18 | 1055 |
332 rows × 1 columns
同样,每天的确诊病例数可以绘制如下:如果您预先设置了上述图表格式,则此后也将应用相同的图表格式。
plt.plot(daily_cases)
plt.show()
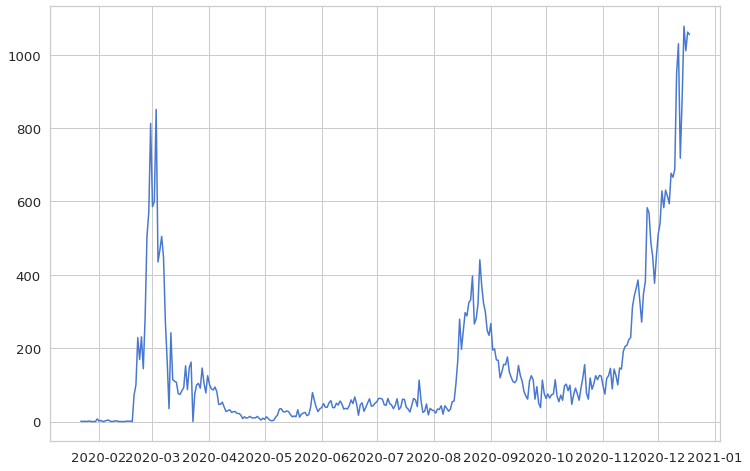
从3月初到8月底,病例急剧增加,我们可以看到确诊病例不断出现。而到了年底,又呈现出上升趋势。
在本章中,我们研究了世界各地和韩国确诊的冠状病毒病例数的数据。在下一章中,我们将了解韩国每日确诊冠状病毒病例数的预处理和建模过程。